TABLE OF CONTENTS
How can I find the results of the Annual Meeting?
Preliminary results will be announced at the Annual Meeting. Final results will be published in a Current Report on Form 8-K to be filed with the SEC within four business days after the Annual Meeting. If the official results are not available at that time, we will provide preliminary voting results in the Form 8-K and will provide the final results in an amendment to the Form 8-K as soon as they become available.
A copy of Dana's Annual Report on Form 10-K for the fiscal year ended December 31,
2019,2021, as filed with the SEC, may be
obtained without charge upon written request to the Corporate Secretary, Dana Incorporated, 3939 Technology Drive, Maumee, Ohio 43537.Dana’sProxy Statement
The proxy statement and
Annual Report on Form 10-KDana’s annual report to shareholders are available on our website at www.dana.com/proxy.
TABLE OF CONTENTS
Following are the names and ages of the executive officers of Dana, their positions with Dana and summaries of their backgrounds and business experience. Our executive officers are those individuals who serve on Dana’s Executive Leadership Team. All executive officers are elected or appointed by the Board of Directors and hold office until the annual meeting of the Board of Directors following the annual meeting of shareholders in each year.
| | Aziz S. Aghili | | | 6163
| | | Executive Vice President and President, Heavy Vehicle (since April 2021), Executive Vice President and President, Off-Highway Drive and Motion Systems (since February 2020), Executive Vice President, President of Off-Highway Drive and Motion Systems (August 2018 to February 2020)April 2021), President, of Off-Highway Drive and Motion Systems (July 2011 to August 2018), Dana Incorporated. | | | 2011 - Present | |
| | Jonathan M. CollinsByron S. Foster
| | | 4053
| | | President, Light Vehicle Drive Systems (since July 2021), Senior Vice President and Chief Commercial, Marketing and Communications Officer (February 2021 to July 2021), Dana Incorporated. Prior to joining Dana, Mr. Foster held senior executive roles at Johnson Controls, Inc., and Adient plc for more than two decades. | | | 2021 - Present | |
| | James K. Kamsickas | | | 55 | | | Mr. Kamsickas has served as Chairman of the Board of Directors since December 2019 and President and Chief Executive Officer of Dana Incorporated since August 2015. Prior to joining Dana, Mr. Kamsickas served as President and Chief Executive Officer of International Automotive Components (IAC) Group S.A., a leading global supplier of automotive interior components and systems. He also served as a member of IAC’s Board of Directors from 2007-2015. Prior to that, he spent 18 years at Lear Corporation in numerous domestic and international positions, ultimately as leader of its Interior Systems Division. | | | 2015 - Present | |
| | Timothy R. Kraus | | | 53 | | | Senior Vice President and Chief Financial Officer (since January 2017)December 2021), Senior Vice President of Finance and Chief Financial Officer (MarchTreasurer (January 2017 to December 2021), Vice President of Finance and Treasurer (December 2016 to January 2017), Dana Incorporated; Senior Vice President and Chief Financial Officer (April 2013 to March 2016), Vice President, Finance (October 2010 to April 2013), ProQuest (a global information, content and technology company).Incorporated. | | | 20162021 - Present
| |
James K. Kamsickas
| 53
| Chairman of the Board (since December 2019), President and Chief Executive Officer (since August 2015), Dana Incorporated; President, Chief Executive Officer (April 2012 to August 2015), Global Co-Chief Executive Officer and President of North America and Asia (January 2011 to April 2012), President and Chief Executive Officer of North America and Asia (April 2007 to December 2010), International Automotive Components Group, S.A. (global supplier of automotive interior components and systems). Prior to IAC, Mr. Kamsickas held numerous domestic and international positions over 18 years with Lear Corporation (a leading global supplier of automotive seating and electrical systems).
| 2015 - Present
|
Douglas H. Liedberg | | | 5254
| | | Senior Vice President, General Counsel and Secretary, Chief Compliance and Sustainability Officer (since January 2020), Senior Vice President, General Counsel and Secretary, Chief Compliance Officer (since May 2017), Associate General Counsel (November 2008 to April 2017), Dana Incorporated. | | | 2017 - Present | |
| | Dwayne E. MatthewsAntonio Valencia
| | | 6056
| | | President, Power Technologies and Senior Vice President, Global Electrification, (since September 2009)April 2020), Senior Vice President, China and India (January 2016 to April 2020), Dana Incorporated. | | | 20112020 - Present
|
Robert D. Pyle
| 53
| Executive Vice President and President, Light Vehicle Drive Systems (since January 2020), President, Light Vehicle Driveline Technologies (January 2014 to February 2020); President of Asia Pacific (May 2012 to December 2013), Dana Incorporated.
| 2014 - Present
|
Mark E. Wallace
| 53
| Executive Vice President and President, Commercial Vehicle Drive and Motion Systems and Aftermarket (since February 2020), Executive Vice President, President, Dana Commercial Vehicle Driveline Technologies, Aftermarket & Operational Excellence (August 2016 to February 2020), Executive Vice President, Dana On-Highway Driveline Technologies (January 2014 to August 2016), Executive Vice President (June 2011 to January 2014), President of Light Vehicle Driveline Technologies (September 2012 to January 2014), Dana Incorporated.
| 2008 - Present
|
TABLE OF CONTENTS
Compensation Discussion and Analysis
Introduction
Our Compensation Discussion and Analysis (CD&A) provides information about the executive compensation philosophy, key principles and approaches
Danathe Company uses to determine the elements of compensation awarded to, earned by and paid to each of our named executive officers (NEOs) during
2019.2021. This discussion offers context to the compensation disclosures included in the accompanying compensation tables and corresponding narrative discussion and footnotes below, and it should be read in conjunction with those disclosures.
Our NEOs for 20192021 whose compensation is discussed in this CD&A and is included in the related tables are:
| | James K. Kamsickas | | | Chairman of the Board and Chief Executive Officer | |
| | Timothy R. Kraus | | | Senior Vice President and Chief Financial Officer | |
| | Jonathan M. CollinsCollins* | | | Former Executive Vice President and Chief Financial Officer | |
| | Mark E. WallaceAziz S. Aghili
| | | Executive Vice President and President, CommercialHeavy Vehicle Drive and Motion Systems and Aftermarket | |
| | Aziz S. AghiliDouglas H. Liedberg
| | | ExecutiveSenior Vice President, General Counsel and President, Off-Highway DriveSecretary, Chief Compliance and Motion SystemsSustainability Officer
| |
| | Robert D. Pyle*Antonio Valencia
| | | President, Light Vehicle Drive SystemsPower Technologies and Senior Vice President, Global Electrification | |
*Mr. PyleCollins voluntarily departed the Company effective December 15, 2021.
Executive Overview
Business Summary
The past year once again brought with it extraordinary challenges as the effects of the COVID-19 pandemic, both direct and indirect, continued throughout 2021. We experienced record raw-material cost inflation, significant supply-chain constraints, and critical labor shortages that continue to impact the global mobility industry. Despite these difficult challenges, our associates around the globe again proved their resilience, delivering world-class employee safety performance while demonstrating Dana’s steadfast commitment to serving our customers in an environment of record demand across all of our end markets.
While we fell short of our financial targets in 2021 due to the aforementioned challenges, we continued the vital work of transforming the company for electrification, of fostering an environment of inclusion and diversity where all ideas are welcomed and every employee feels safe, and of accelerating our commitment to reducing our total annual Scope 1 and Scope 2 greenhouse gas emissions by more than 50 percent five years ahead of our original 2035 goal.
We earned numerous safety, ethics and Top Employer awards in 2021. Dana was named
Executive Vice Presidentone of America’s Most Responsible Companies by Newsweek for the third consecutive year. In addition, we were selected for the inaugural Sustainability Award from ATZ / MTZ Group and
President, Light Vehicle Drive Systems effective January 1, 2020Executive Overview
Business Performance & Financial Results
Roland Berger. We were also recognized by a number of our customers, including Caterpillar, General Motors, PACCAR, John Deere and Toyota, among others. Our key 2019 businessSpicer ElectrifiedTM e-Powertrain earned the New Power Technology Award and financial highlights:
| ► | Experienced a record top-quartile year for safety performance with across-the-board improvements in lost-time and recordable incidents, and severity rates. |
| ► | Recorded significant enhancements to Dana’s Sustainability and Social Responsibility programs, including employee engagement and diversity and inclusion programs (see www.dana.com/company/sustainability-and-social-responsibility). |
| ► | Recognized as a top workplace employer at our facilities in the Asia-Pacific region, and in India, Italy, Mexico and the U.S. |
| ► | Successfully integrated strategic acquisitions including Oerlikon Drive Systems, SME and Nordresa, exceeding cost synergy targets and strengthening Dana’s e-Portfolio and broader electric vehicle position. |
| ► | Received more than 35 customer and industry honors across all business units, most notably, awarded the 2019 PACE Award for our Spicer AdvanTEK Ultra axle system, and named Supplier of the Year by both General Motors and FCA. |
| ► | Delivered $477 million year-over-year sales growth, up 6% to $8.6 billion, including an additional $350 million of organic sales backlog. |
| ► | Achieved $62 million of incremental Adjusted EBITDA, up 6% to $1.019 billion, for an Adjusted EBITDA margin of 11.8% and diluted adjusted earnings per share of $3.06. |
| ► | Produced a third consecutive year of Adjusted Free Cash Flow growth, increasing 12% to $272 million and yielding in excess of 3% of sales. |
| ► | Our shareholders enjoyed a 34% appreciation in the price of Dana shares over the course of 2019. |
the Achievement of the Year Award at the 2021 Diesel Progress Summit, further demonstrating our innovation capabilities.
TABLE OF CONTENTS
Dana’s Compensation Philosophy
The objective of our executive compensation program is to retain, attract, motivate and reward our senior leaders in the successful execution of our strategy. Our long-range enterprise strategy builds on our strong foundation of innovation and technology and leverages our operating model, driven bydriving cross functional resource sharing while maintaining a customer centric focus. Our strategy furthers the expansion of our global markets and accelerates the commercialization of new technology, enabling us to sustain our profitable growth trajectory while capitalizing on our position as a leader in electrified mobility. As such, theThe program is designed to balance short-term performance with long-term growth, offering compensation and benefits that are competitive with executive compensation arrangements provided to executive officers at similar levels at comparably sized companies with whom we compete for talent.
TABLE OF CONTENTS
Dana’s executive compensation philosophy is reviewed annually by the Compensation Committee, with a focus on the following key goals:
| | ✓ | | | Reward performance – A substantial percentage of executive pay is performance-based and therefore at risk. Our pay programs reflect our “pay-for-performance” culture that aligns incentives with shareholder interests. | | | ✓ | | | Drive ownership mentality – We require executives to personally invest in Dana’s success through stock ownership guidelines that require executives to own a significant amount of our stock. | |
| | ✓ | | | Emphasize long-term incentive compensation –We share a portion of the value created for shareholders with those responsible for the results through our performance-based long-term incentive compensation plans. Performance Shares reward executives for delivering long-term Adjusted EBITDA Marginprofitability and Return on Invested Capital (ROIC)cash flow performance. | | | ✓ | | | Retain, reward and attract the best talent to achieve superior results – To consistently outperform our competitors, it is crucial that we need to retain and recruit superior talent capable of driving superior results. We have structured our compensation program to motivate and reward these results. | |
Dana’s Executive Compensation Practices
Dana’s executive compensation program features many best practices that serve shareholder interests.
| | ► | | | Base half of our long-term compensation on the achievement of objective, pre-established goals tied to financial, operational, and strategic measures. | | | ► | | | No excise tax gross ups. | |
| | ► | | | Award incentive compensation based on objective measures. | | | ► | | | No excessive perquisites. | |
| | ► | | | Apply an accelerated schedule to meet minimumleading practice stock ownership guidelines. | | | ► | | | No hedging or pledging of Dana stock. | |
| | ► | | | Maintain a clawback policy to recapture unearned incentive payments.payments in the event of a restatement of our financial results. | | | ► | | | No excessive change-in-control or executive severance provisions. | |
| | ► | | | Retain an independent compensation consultant. | | | | | | | |
| | ► | | | Include double triggerdouble-trigger vesting of equity awards and severance payments upon a change in control. | | | | | | | |
Say on Pay and Shareholder Engagement
Last year’s advisory vote on executive compensation (Say on Pay) was again firmly supported bycontinued to reflect strong support from our shareholders. 93%More than 88% of votes were cast in favor of our pay practices, which we believe signalsdemonstrates that our shareholders understand that our executive compensation program is appropriately aligned with their interests. We value feedback from our shareholders and throughout 20192021 we wereremained actively engaged with shareholders through participation in numerous investor meetings and conferences, many of which were attended by our Chairman and CEO. In addition, we hosted an investor day in March where we presented our refreshed enterprise strategy, Powering into e-Drive. conferences.
The Compensation Committee consideredconsiders the favorable Say on Pay vote and other factors explained in our CD&A in evaluating the executive compensation program, and in 2021 approved changes and other refinements to elements of our program to ensure the continued alignment of Dana’s strategy and business goals with shareholders’ long-term interests. Those changesNotable recent enhancements include:
| ► | an increased emphasis on free cash flow and value creation in incentive compensation; |
| ► | incorporating relative performance metrics, including Relative TSR, into our incentive programs; |
| ► | augmenting and expanding executive share ownership requirements; and |
| ► | the elimination of cash perquisite allowances for our NEOs. |
Changes to the executive compensation program are
outlineddescribed in further detail later in this discussion and analysis.
TABLE OF CONTENTS
Relationship Between Dana’s Pay &and Performance
One of the factors our Compensation Committee uses in setting executive compensation is an evaluation of how our target compensation and benefits levels compare with those of similarly situated executives at companies that comprise our executive compensation peer group (Peer Group). Dana’s philosophy for senior executive pay, including NEO pay, is to target a range of +/
- 15%-15% of the 50
th percentile of our Peer Group and general industry market data as provided by the Compensation Committee’s independent compensation consultant. In addition to market data, other factors, such as an individual’s experience, responsibilities and long-term strategic value to Dana, are also considered when making recommendations and decisions on compensation.
The Peer Group used for benchmarking executive pay for all NEOs is made up of companies that are:
| ► | in similar industries where Dana competes for talent, customers and capital –including auto components, high-tech industrial, construction and farm machinery, heavy trucks and other durable goods manufacturers;manufacturers, |
| ► | of similar size (as measured by annual revenue), with a range of aboutapproximately 1/3rd to 3x Dana’s revenue that results in a median revenue close to Dana’s;Dana’s, and |
| ► | of similar complexity to Dana (e.g., multi-country and multi-segment). |
The Peer Group is reviewed annually by the Compensation Committee and modifications are made to ensure each company in the group meets the above comparison criteria. The 21 companies shown in the table below comprise our Peer Group:
| | Adient plc | | | Ingersoll-Rand Inc. | |
| | American Axle & Manufacturing Holdings, Inc. | | | Lear Corporation | |
| | BorgWarner Inc. | | | Meritor, Inc. | |
| | Cooper-Standard Holdings Inc. | | | Navistar International Corporation | |
| | Cummins Inc. | | | OshKosh Corporation | |
| | Dover Corporation | | | Parker-Hannifin Corporation | |
| | Eaton Corporation plc | | | Tenneco Inc. | |
| | Emerson Electric Co. | | | Terex Corporation | |
| | Flowserve Corporation | | | The Timken Company | |
| | Fortive Corporation | | | Trane Technologies plc | |
| | Illinois Tool Works Inc. |
| | | BorgWarner Inc.
| Ingersoll-Rand plc
|
Cooper-Standard Holdings Inc.
| Lear Corporation
|
Cummins Inc.
| Meritor, Inc.
|
Delphi Technologies PLC
| Navistar International Corporation
|
Dover Corporation
| OshKosh Corporation
|
Eaton Corporation plc
| Parker-Hannifin Corporation
|
Emerson Electric Co.
| Tenneco Inc.
|
Flowserve Corporation
| Terex Corporation
|
Fortive Corporation
| The Timken Company
|
In 2019, theThe Compensation Committee, after review with its executive compensation consultant, madedetermined that each company comprising the following changes2020 Peer Group continued to meet the comparison criteria with the exception of Delphi Technologies due to the Peer Group. Cooper Tire & Rubber Company and Rexnord Corporation werecompletion of its acquisition by BorgWarner. As a result, Delphi was removed as both companies fall below the ideal revenue range. Eaton Corporation plc, Emerson Electric Co. and Illinois Tool Works Inc. werea compensation peer. Adient was added as a compensation peers due topeer based on the criteria described above, including industry similarities to Dana in terms of industry and geographic complexity, diversity of business segments and the varied global markets they each serve.
as a direct competitor for executive talent.
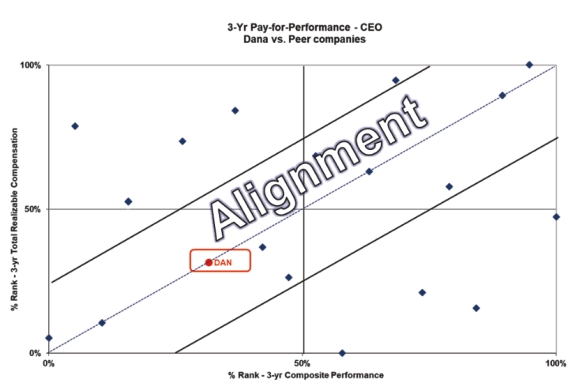
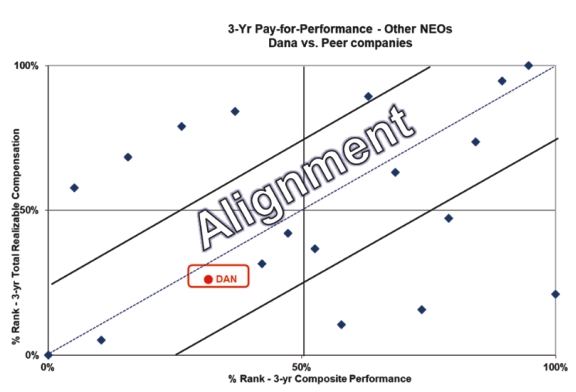
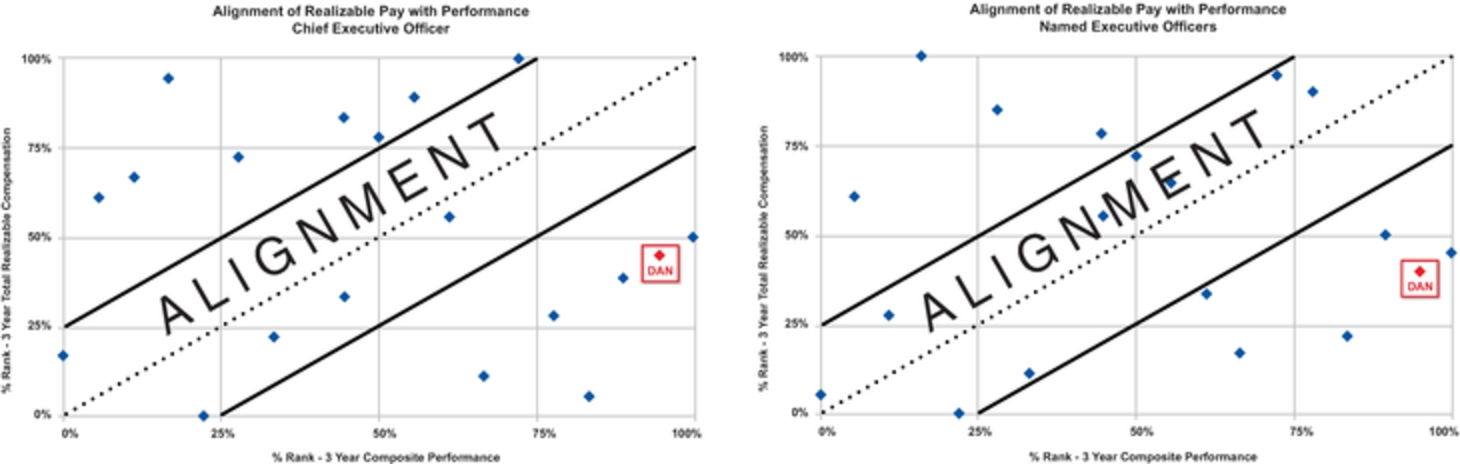
Pay for Performance
We believe it is important to look at how NEO realizable pay compares to Dana’s performance asbecause realizable pay is the pay that NEOs actually or could potentially receive and demonstrates how pay is designedlinked to link to such performance. The Compensation Committee and management analyzed the alignment between the pay of our NEOs and Dana’s three-year (2016-2018)(2018-2020) performance relative to the Peer Group. The table below showsprovides the characteristicsdefinition of realizable pay and the performance metrics that were used for the study.pay-for-performance comparison.
| | Realizable Pay includes base salary, actual bonus payouts and theoretical gains of long-term incentive grants from 20162018 through 20182020 (“in-the-money” portion of options, all restricted stock awards/units granted and performance share/cashaward payouts). Long-term incentives include the value of the awards granted at the end of the three-year period, of the awards granted, which is not necessarily the value at vesting or exercise. | | | Note that this differs from the summary compensation table pay, which represents the grant-date fair value of the long-term incentive awards.
For purposes of this analysis, the following financial metrics were used — free cash flow growth, EBITDA growth, ROIC and revenue growth. | |
TABLE OF CONTENTS
The following graphs show the correlation between realizable pay and the financial performance
measuresmetrics indicated above over
athe three-year period
from 2018 through 2020 for Dana’s CEO and other NEOs, and the CEOs and other NEOs in our Peer Group. Performance is indicated across the horizontal axis (stronger performance from left to right) and compensation is reflected on the vertical axis (higher pay from bottom to top) of each of the graphs. Peers lacking the full three years of data have been excluded from the analysis.
To align pay levels for our NEOs with Dana’s performance, our pay mix places the greatest emphasis on performance-based incentives. A significant majority
(86%(87% of our Chairman and CEO’s target compensation and
75%74% of the average target compensation of our other NEOs) is performance-based.
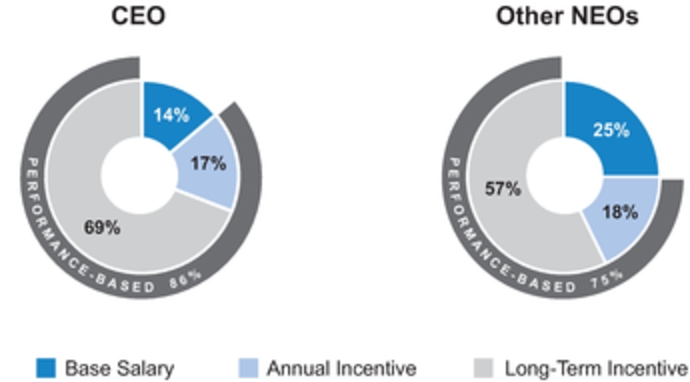
TABLE OF CONTENTS
Elements of the 20192021 Executive Compensation Program
Our annual executive compensation program has three primary pay components: base salary, annual performance-based cash bonuses and long-term equity incentives. We also offer retirement and additional benefits.
| | | | | FIXED | | | | | | Base salary | | | ► | | | Fixed compensation payable in cash. Reviewed annually and adjusted when appropriate. | | | ► | | | Provide base level of competitive cash compensation for retaining and attracting executive talent. | | | ► | | | Experience, job scope, market data and individual performance. | |
| | | | | VARIABLE | | | | | | Annual cash incentive award | | | ► | | | Variable compensation payable in cash based on performance-related financial and individual goals. | | | ► | | | MotivateIncentivize high performance levels and reward short-term Dana-wide, business unitconsolidated and individual performance.
| | | ► | | | Corporate funding pool is based on financial performance metrics (Adjusted EBITDA, Adjusted EBITDA Margin and Adjusted Free Cash Flow) andaligned with the annual operating plan, as well as individual performance goals.goals tied to the delivery of strategic and other objectives. | |
| | | | | | | | | | | Performance share awards
(PSA) (PSAs) | | | ► | | | PSAs vest after a three-year performance period based on achieving financial and shareholder return metrics. | | | ► | | | Align the interests of shareholderssenior executives with those of senior executivesshareholders around long-term value creation and executive talent retention. | | | ► | | | Target awards based on job scope, market data and individual performance. | |
| | | | | | | | | | | | | | | | | | | | ► | | | Minimize short-term risk-taking behaviors forin the interest of positive long- termlong-term results. | | | ► | | | Payouts are basedearned on ourthe basis of performance onassociated with specified financial metrics (Adjusted EBITDA Margin & Pre-Tax ROIC)growth and Adjusted Free Cash Flow growth relative to initial baseline targets) and Relative Total Shareholder Return over a three-year period. | |
| | | | | | | | | | | Restricted stock units
(RSU) (RSUs) | | | ► | | | RSUs vest ratably on the first, second and third anniversary of the grant date. | | | ► | | | Increase long-term equity ownership and focus executives on providing shareholders with superior investment returns. | | | ► | | | Target award based on job scope, market data and individual performance. | |
| | | | | | | | | | | | | | | | | | | | ► | | | Vesting terms and ownership guidelines promote retention and a strong linkage to the long-term interests of shareholders. | | | | | | | |
Base Salary
We provide base salaries to compensate our NEOs for their primary roles and responsibilities, and to provide a stable level of annual compensation. Actual NEO salary levels and increases vary based on the NEO’s role, level of responsibility, experience, individual performance, future potential and market value. In addition, salary increases may be warranted because of a promotion or change in responsibilities.
Considering market-based positioning and each NEO’s individual performance, the Compensation Committee approved the 2019 annualized base salary adjustments (effective April 1, 2019) below:
NEO | 2018 Salary | 2019 Salary | Percent
Increase |
James K. Kamsickas | $ | 1,152,600 | | $ | 1,175,000 | | | 1.9 | % |
Jonathan M. Collins | $ | 615,000 | | $ | 658,000 | | | 7.0 | % |
Mark E. Wallace | $ | 605,000 | | $ | 611,000 | | | 1.0 | % |
Aziz S. Aghili | $ | 550,000 | | $ | 565,000 | | | 2.7 | % |
Robert D. Pyle | $ | 540,000 | | $ | 546,000 | | | 1.1 | % |
TABLE OF CONTENTS
Base
The Compensation Committee approved the 2021 annualized base salaries shown in the table below. The salary increases
consider performance, market movementfor Messrs. Kraus, Aghili and
other factors. A higher increase, as a percent of salary,Valencia reflect new or expanded responsibilities assumed during the year. Mr. Kraus was
providednamed Senior Vice President and Chief Financial Officer in December 2021. Mr. Aghili assumed responsibility for the Commercial Vehicle Drive and Motion Systems business unit in April 2021 in addition to
his existing responsibility for the Off-Highway Drive and Motion Systems business unit. Mr.
Collins to alignValencia’s responsibilities were expanded in connection with
base compensation comparable to executives in similar positions within Dana’s Peer Group.his Power Technologies and Electrification roles.
| | James K. Kamsickas | | | $1,200,000 | | | $1,250,000 | |
| | Timothy R. Kraus | | | $450,036 | | | $600,000(1) | |
| | Jonathan M. Collins | | | $683,000 | | | $716,000 | |
| | Aziz S. Aghili | | | $590,000 | | | $650,000 | |
| | Douglas H. Liedberg | | | $525,000 | | | $550,000 | |
| | Antonio Valencia | | | $463,994(2) | | | $545,858(2) | |
(1)
| Salary effective upon Mr. Kraus’ appointment as Senior Vice President and Chief Financial Officer. |
(2)
| Mr. Valencia’s compensation was generally denominated in Swiss francs and was converted to US dollars using a year-end average exchange rate of 1.091715 US dollars per Swiss franc. |
Annual Performance-Based Cash Incentive
Our performance-based annual bonus program, the Dana Annual Incentive Plan (AIP), is a cash-based plan intended to motivate and reward employees based on
Dana-wide, business unit andDana’s consolidated financial results as well as individual performance that
drivedrives shareholder value.
The AIP covers approximately
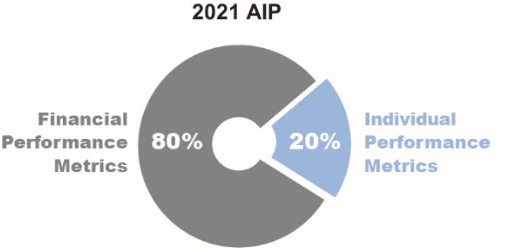
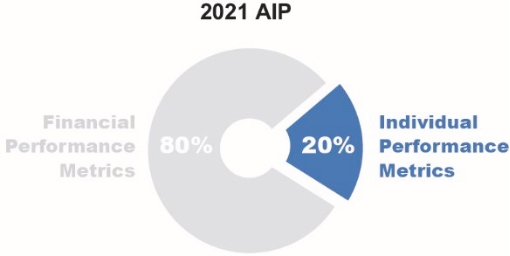
3,3004,000 employees, including our NEOs. At the beginning of each year, the Compensation Committee reviews and approves an annual cash bonus target for each NEO as a percentage of base salary for the upcoming performance period. The NEOs may earn from 0% to 200% of their target incentive opportunity. 80% of the incentive opportunity is based on actual consolidated
and business unit financial performance compared to targets and 20% is based on individual performance goals focused on driving strategic, operational and other priorities of the business. All
NEOs’ performance-related goals are approved by the Compensation Committee.
For our NEOs, the 2019
The 2021 AIP target payout opportunities and results weightings with respect to our NEOs are shown in the table below:
| | James K. Kamsickas | | | 125% | 125
| %
| 80% Consolidated | | | 20% Individual | |
| | Jonathan M. CollinsTimothy R. Kraus
| | | 75% | 75
| %
| 80% Consolidated | 20% Individual
|
Mark E. Wallace
| | 75
| %
| 40% Consolidated
40% Business Unit
| 20% Individual | |
| | Aziz S. AghiliJonathan M. Collins
| | | 90% | | | 7580% Consolidated
| %
| 40% Consolidated
40% Business Unit
| 20% Individual | |
| | Robert D. PyleAziz S. Aghili
| | | 80% | | | 7080% Consolidated
| %
| 40% Consolidated
40% Business Unit
| 20% Individual | |
| | Douglas H. Liedberg | | | 70% | | | 80% Consolidated | | | 20% Individual | |
| | Antonio Valencia | | | 65% | | | 80% Consolidated | | | 20% Individual | |
Following thea Peer Group compensation benchmarking review and an evaluation of our NEOs’ respective roles and responsibilities, the Compensation Committee determined that for 2019, no changesapproved increases to the AIP target opportunities were needed for anyMessrs. Kraus (from 50% to 75%, corresponding to his appointment as Senior Vice President and Chief Financial Officer of the Company), Aghili (from 75% to 80%), Liedberg (from 65% to 70%) and Valencia (from 60% to 65%) effective with the 2021 plan year. Also effective with the 2021 plan year, the Company’s consolidated results were used in determining the AIP financial performance metrics payout for all plan participants, including our NEOs, asto increase incentives promoting an enhanced collaborative operating approach leveraging Dana’s core capabilities. As such, the target opportunity levels were within the competitive pay range for each position. The performance results weightings forapplicable to Messrs. Wallace, Aghili and Pyle remained atValencia no longer separately consider the performance of the business units over which they have responsibility (previously 40% business unit and 40% consolidated results to continue to incentivize and reward leveraging core capabilities, resources and knowledge across Dana.of their target opportunity).
TABLE OF CONTENTS
The 2019
2021 AIP
performance was based on four key
performance metrics shown in the table below and was designed to reward the achievement of performance goals at the consolidated
business unit and individual levels.
Effective with the 2019 AIP,Each of the financial performance
metric weightings were rebalanced so that each metric hadmetrics maintained an equal weighting
which wasin the 2021 plan, designed to
enhance incentives related to, and to better align with, profit margin expansionprovide an appropriate level of motivation around profitability, margins and free cash flow,
generation which are key value drivers of our business.
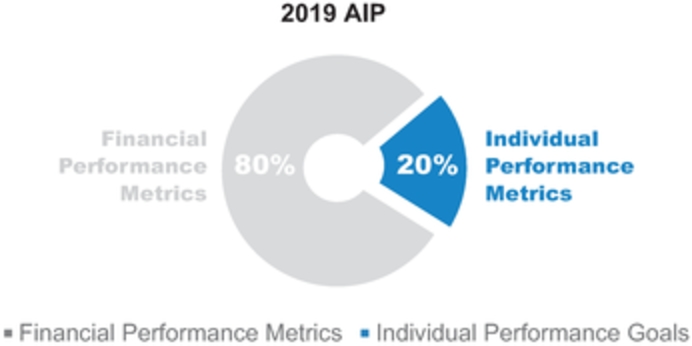
Annual Incentive Plan Metrics | 2019 Weighting | Prior Weighting |
Financial Performance Metrics | | | | | | | | | | | | |
Adjusted EBITDA | | 1/3rd | | | } | | | 80 | % | | 60 | % |
Adjusted EBITDA Margin | | 1/3rd | | | 20 | % |
Adjusted Free Cash Flow | | 1/3rd | | | 20 | % |
Individual Performance Goals | | | | | | | | 20 | % | | 20 | % |
| | Financial Performance Metrics | | | | | | | | | | |
| | Adjusted EBITDA | | | 1/3rd | | | } | | | 80% | |
| | Adjusted EBITDA Margin | | | 1/3rd | |
| | Adjusted Free Cash Flow | | | 1/3rd | |
| | Individual Performance Goals | | | | | | | | | 20% | |
Our incentive plans make certain adjustments toThe Adjusted EBITDA and Adjusted Free Cash Flow measures used in our publicly reported financial results form the basis of operations for the purposeperformance metrics that are components of calculating incentive awards. Such adjustments are designed to provide a comparable basis from year to year from which incentive awards are calculated to ensure that participants in the plan are incentivized and rewarded properly.
our AIP. Adjustments to EBITDA generally include equity grant expense, restructuring expense, non-service cost components of pension and other postretirement benefits costs and other adjustments not related to our core operations (e.g., gains or losses on debt extinguishment, pension settlements, divestitures and impairments, etc.). With these adjustments for incentive plan purposes, there is alignment with the Adjusted EBITDA measure used in our publicly reported financial results. Adjustments to Free Cash Flow include discretionary pension contributions. AnFor the purpose of calculating the annual incentive award, an additional adjustment for incentive compensation is made to remove the effects of currency exchange rate fluctuations on Adjusted EBITDA and Adjusted EBITDA Margin, which may have a significant impact on our financial results given our international footprint, and which is not within management’s control.
TABLE OF CONTENTS
Company Financial Metrics and Performance
Dana’s financial performance makes up 80% of the overall AIP awards for the NEOs and is measured by three equally weighted financial metrics: Adjusted EBITDA, Adjusted EBITDA Margin and Adjusted Free Cash Flow. We believe these metrics are appropriate measures of our underlying earnings, and align with our overall business enterprise strategy and our external financial reporting commitments.commitments, and drive shareholder value.
| | | | |
To determine whether annual incentive awards are paid, performance for the year is measured against specified target levelstargets for each financial and individual performance goal. The target for 100% annual incentive achievementEach of the three financial metric targets was based on achieving the levels of the three financial metrics from Dana’s (and each business unit’s) annual operating plan reflecting a level of performance which, at the time, was anticipated to be challenging but achievable.attainable. The threshold level was set to be reflective of performance at which the Compensation Committee believed a portion of the award opportunity should be earned. The maximum level was set well above the target, requiring significant achievements and reflecting performance at which the Compensation Committee believed a 200% target award wasis warranted.
Consolidated
AIP Performance
The weighting,
Weighting, target performance, actual performance and
the payout
associated with each of the
20192021 AIP metrics
at the consolidated level are shown in the table below.
In addition to the change to the weighting for the metrics in the 2019 AIP, theMetric weightings and performance ranges
associated withapproved by the
Adjusted EBITDA and Adjusted EBITDA Margin metrics were modifiedCompensation Committee are intended to complement the rigor inherent in our target-setting processes by further incentivizing the attainment of superior performance outcomes.
AIP Performance Metrics | Weight | Threshold | Target | Maximum | Actual | Payout
(% of Target) |
Adjusted EBITDA | 1/3rd | $956M | $1,125M | $1,294M | $1,031M | 58% |
Adjusted EBITDA Margin | 1/3rd | 11.7% | 12.3% | 12.9% | 11.8% | 38% |
Adjusted Free Cash Flow | 1/3rd | $234M | $275M | $316M | $272M | 95% |
Weighted Payout for Consolidated Metrics: | 64% |
Business Unit AIP Performance
For Mr. Wallace, 40% of his AIP award is based on the weighted payout of the three performance metrics described above for the Commercial Vehicle Drive and Motion Systems business unit for which he is responsible. The weighted payout for Adjusted EBITDA, Adjusted EBITDA Margin and Adjusted Free Cash Flow in the Commercial Vehicle Drive and Motion Systems business unit was 0% of Target.
For Mr. Aghili, 40% of his AIP award is based on the weighted payout of the three performance metrics described above for the Off-Highway Drive and Motion Systems business unit for which he is responsible. The weighted payout for Adjusted EBITDA, Adjusted EBITDA Margin and Adjusted Free Cash Flow in the Off-Highway Drive and Motion Systems business unit was 51% of Target.
For Mr. Pyle, 40% of his AIP award is based on the weighted payout of the three performance metrics described above for the Light Vehicle Drive Systems business unit for which he is responsible. The weighted payout for Adjusted EBITDA, Adjusted EBITDA Margin and Adjusted Free Cash Flow in the Light Vehicle Drive Systems business unit was 96% of Target.
For all individual business units, goals are not disclosed due to competitive harm concerns.
| | Adjusted EBITDA | | | 1/3rd | | | $774M | | | $910M | | | $1,047M | | | $795M | | | 37% | |
| | Adjusted EBITDA Margin | | | 1/3rd | | | 10.4% | | | 11.0% | | | 11.5% | | | 8.9% | | | 0% | |
| | Adjusted Free Cash Flow | | | 1/3rd | | | $212M | | | $250M | | | $287M | | | $(211M) | | | 0% | |
| | Weighted Payout for Financial Metrics | | | | | | | | | | | | | | | | | | 12.4% | |
TABLE OF CONTENTS
Individual Performance Goals
The NEOs’ individual performance makes up 20% of the overall AIP award. For 2019, the NEOs’2021, each executive leader, including our NEOs, was accountable for individual goals were focused on driving specific priorities such as, but not limited to, employee safety commitments, quality performance, sales growth, financial performance, operational efficiencies, inclusion and diversity outcomes, sustainability actions and execution of our overall business strategy. | | | | |
The Compensation Committee reviews the strategic, operational and other individual performance goals for the Chairman and CEO and other NEOs. The Chairman and CEO sets forth each of the other NEO’s individual goals (and the weighting of each goal), subject to approval by the Compensation Committee. The Compensation Committee sets the individual goals and weighting of each goal for the Chairman and CEO.
The
levelsCommittee recognized the operating and financial challenges experienced during the year and determined to use its discretion to limit the level of achievement
(0% - 200% of
targeted goals) for the individual
performance portiongoals to 100% of
the 2019 Annual Incentive awardtarget for each of
our NEOs were: Mr. Kamsickas (100%), Mr. Collins (103%), Mr. Wallace (108%), Mr. Aghili (116%) and Mr. Pyle (95%).2019the NEOs.
2021 Annual Incentive Plan Results
The annual incentive paymentpayments for 2019,our NEOs under the 2021 AIP, based on the financial and personalindividual performance metrics showndescribed above, for the NEOs are shown in the table below:following table. Mr. Collins forfeited his award as a result of his voluntary departure from the Company on December 15, 2021.
| | James K. Kamsickas | | | $1,045,750467,188 | |
| | Jonathan M. CollinsTimothy R. Kraus
| | | $354,333134,550 | |
Mark E. Wallace
| $216,294
|
Aziz S. Aghili | | | $294,930155,480 | |
| | Robert D. PyleDouglas H. Liedberg
| | | $317,226115,115 | |
| | Antonio Valencia | | | $106,087 | |
The performance and payout range (threshold, target and maximum incentive opportunity) of annual cash incentives for reaching 2019 performance goals under the 2019 AIP for each of our NEOs is provided in the table titled “Grants of Plan-Based Awards.”Awards”. The actual award paid, as shown in the table above, is also provided in the “Non-Equity Incentive Plan Compensation” column of the “Summary Compensation Table” below.
Long-Term Incentive Program
We believe that Dana’s long-term performance is driven through an ownership culture that rewards executives for creating and maximizing shareholder value. Our Long-Term Incentive Program (LTIP) provides participants, including our NEOs, with incentive awards that serve an important role by balancing short-term goals with long-term shareholder value creation while minimizing risk-taking behaviors that could negatively affect long-term results.
The Compensation Committee approves the amount of
eachthe long-term incentive award, which is based on a percentage of the NEO’s base salary. Each NEO’s award opportunity is based on a target dollar value (determined prior to the beginning of the performance period) assigned to his or her position based on market comparisons for similar positions, using both Peer Group and general industry market data. For
2019,2021, following its market data review, the Compensation Committee approved an increase
into Mr. Kamsickas’ LTIP target opportunity to
better alignmaintain alignment with long-term compensation opportunities afforded chief executive officers of the companies in Dana’s Peer Group.
Similarly, the Compensation Committee approved an increase for Mr.
Aghili’s target opportunity increasedValencia to better align with the market. Mr. Collins forfeited all of his long-term incentive awards, including his 2021 award, as a result of his
promotion to Executive Vice President duringvoluntary departure from the
prior year. No other changes were made to the 2019 target LTIP opportunities for any of our other NEOs as the target opportunity levels were within the competitive pay range for each of their positions.50%Company.
Half of the total value of the target long-term incentive opportunity is delivered through performance share awards (PSAs) and the other
50%half through restricted stock units (RSUs). We believe both PSAs and RSUs are forms of performance-based incentive compensation because PSAs provide direct alignment with shareholder interests and the value of RSUs fluctuates based on stock price performance.
TABLE OF CONTENTS
In addition to requiring achievement of performance criteria in respect of the performance shares, PSAs and RSUs require the NEO to remain employed with Dana for three years from the grant date, unless the NEO
attainsdeparts and is retirement
eligible (retirement is defined as age
(age 60 with at least 10 years of service, or age 65 regardless of service) whereby a prorated award is paid. The
grant date value of PSAs and RSUs granted to each of our NEOs in
20192021 (using the valuation methodologies required by the SEC disclosure rules) is shown in the “Summary Compensation Table”.
The LTIP is designed to provide PSAs
forto a select group of senior executives, including our NEOs. PSAs are tied to the achievement of two
financial performance measures of equal weight, Adjusted EBITDA
Margin and
Adjusted Free Cash Flow, and Total Shareholder Return
on Invested Capital (ROIC)relative to a pre-established index (“Relative TSR”). Each metric is
based onmeasured over a three-year performance period
(2019-2021) with a performance range that(2021-2023) and PSAs can
result in PSAsbe earned from 0% to 200% of
the target opportunity.
The inclusion This combination of Adjusted EBITDA Margin drivesmetrics incentivizes performance associated with profitability, cash flow and shareholder return and is intended to drive execution of our long-term expansion commitmentsfinancial and strategic objectives while aligning with an emphasis on shareholder return. It also drives profitable sales growth and the optimization of our cost structure. ROIC incentivizes management to allocate Dana’s capital in an effective manner that further drives returns for our shareholders.investor interests. The value of performance shares is also tied to Dana’s stock price performance, which further aligns the executives’ interests with those of shareholders.
The target opportunities of PSAs for the NEOs are shown in the table below:
| | James K. Kamsickas | | | 168,311153,382
| |
| | Timothy R. Kraus | | | 7,509 | |
| | Jonathan M. Collins | | | 44,90339,353(1)
| |
Mark E. Wallace
| 40,639
|
Aziz S. Aghili | | | 36,94528,958
| |
| | Robert D. PyleDouglas H. Liedberg
| | | 31,54222,407
| |
| | Antonio Valencia | | | 17,773 | |
(1)
| All PSAs granted to Mr. Collins were forfeited upon his voluntary departure from the Company on December 15, 2021. |
Restricted Stock Units
The other 50%half of the LTIP design consists of RSU awards. We use RSUs to incentivizemotivate and reward executives for improving long-term stock value and to serve as a retention tool. RSUs are generally granted in February to approximately 160175 senior management employees, including our NEOs, and cliff vest ratably on the first, second and third anniversary of the grant date, provided the recipient remains employed by Dana. The RSUs awarded in 20192021 to the NEOs are shown in the table below, based on target opportunities:below. Mr. Kraus received an additional grant of RSUs upon being named Senior Vice President and Chief Financial Officer. Mr. Aghili received an additional grant of RSUs to recognize his added responsibility for the Commercial Vehicle Drive and Motion Systems business unit. Both grants are shown in the table titled “Grants of Plan-Based Awards at Fiscal Year-End”.
| | James K. Kamsickas | | | 168,311153,382
| |
| | Timothy R. Kraus | | | 7,509 | |
| | Jonathan M. Collins | | | 44,90339,353(1)
| |
Mark E. Wallace
| 40,639
|
Aziz S. Aghili | | | 36,94528,958
| |
| | Robert D. PyleDouglas H. Liedberg
| | | 31,54222,407
| |
| | Antonio Valencia | | | 17,773 | |
(1)
| All RSUs granted to Mr. Collins were forfeited upon his voluntary departure from the Company on December 15, 2021. |
Equity awards granted to each of our NEOs are shown in the “Grants of Plan-Based Awards” table and “Summary Compensation Table” below.
2017
2019 LTIP Performance
(Three-year(three-year performance period ending December 31,
2019)2021)
December 31, 2019 marks2021 marked the end of the three-year performance period for the 20172019 LTIP awards. The performance metrics, targets and performance-payoutperformance payout ranges for suchthese awards were set and approved by the Compensation Committee in February 2017.2019.
TABLE OF CONTENTS
Effective
Consistent with the 20172018 LTIP, Total Shareholder Return (TSR) was replacedPSAs could be earned by the NEOs based on performance associated with Adjusted EBITDA Margin and accordingly, the two equally weighted metrics, for the 2017 LTIP were Adjusted EBITDA Margin and Pre-Tax ROIC.ROIC, both measured as an average over the three-year performance period. The target levels of achievement for the new Adjusted EBITDA Margin metric and the Pre-Tax ROIC metric were setestablished to align with aggressive financial goals establishedset at the beginning of the three-year performance period for each year through 2021.
As a result of the severe impact of the COVID-19 pandemic on our 2020 financial results, the Compensation Committee believed that the results for 2020 did not accurately reflect our management team’s efforts during that year. In response, the Compensation Committee approved an adjustment to our 2020 financial results with respect to the 2019 LTIP, adjusting for the loss of sales due to the global COVID-19 pandemic and providing for a profit contribution at a rate consistent with that experienced in the normal course of business. The adjustment was the same as that made with respect to the 2018 LTIP. The ensuing 2020 pro forma result was then included with the actual performance results of 2019 and 2021 to compute the three-year average and determine the actual award earned in accordance with the 2019 plan design. Although the impact of the pandemic and supply chain disruptions continued during 2021, no adjustments were made to the 2019 or 2021 results for purposes of the 2019 LTIP.
The Compensation Committee believed the adjustments appropriately rewarded executives’ demonstrated leadership throughout the pandemic including a sustained focus on and actions taken to address the ongoing health and safety of our team members across the globe while subsequently navigating the Company through the significant impact of supply chain and labor market disruptions resulting from the pandemic. In deciding to retain the 2020 year’s adjustment for the 2019
fiscal year. The 2017 LTIP awards maintained an equal weighting forPSA payout, the
Compensation Committee also carefully considered retention needs in a disruptive labor market, and the potential negative impact on the Company from a lack of any payout on the 2019 PSAs in spite of the efforts of the team over the last two
performance metrics. TABLE OF CONTENTS
For the 2017-2019 performance period, the Adjusted EBITDA Margin metric underperformed relative to target reflecting challengesyears and our financial results in the operating environment, notably softening demand in key end-markets. With continued improvement in financialyears prior to the pandemic.
After the adjustment, the final payout was 24.4% of target, which the Compensation Committee believed was an appropriate balance between recognizing the team’s efforts, retaining an expectation of paying for performance,
resulting from profitable growth and
effective capital allocation,considering our
Pre-Tax ROIC performance exceeded target levels.stockholders’ interests. The table below summarizes the results of the
20172019 LTIP performance period relative to target and the
actual achievement level of the
20172019 LTIP awards.
Performance Measures
for PSAs
Equal Weighting | 2017-2019 Targets | 2017-2019
Performance
Actual | 2019
Actual
Award |
Threshold | Target | Maximum |
Adjusted EBITDA Margin (2019 Fiscal Year) | | 11.3 | % | | 12.5 | % | | 13.8 | % | | 11.8 | % | | 55 | % |
Pre-Tax ROIC (3-year average) | | 12.2 | % | | 15.2 | % | | 17.5 | % | | 16.2 | % | | 142 | % |
Weighted Payout: | | | | | | | | | | | | | | 99 | % |
| | Adjusted EBITDA Margin (3-year average) | | | 11.1% | | | 12.3% | | | 13.5% | | | 9.7% | | | 10.9% | | | 0% | |
| | Pre-Tax ROIC (3-year average) | | | 16.0% | | | 20.0% | | | 23.0% | | | 13.1% | | | 17.3% | | | 49% | |
| | Weighted Payout: | | | | | | | | | | | | | | | | | | 24.4% | |
The actual payout of PSAs to the NEOs, awarded as part of the 20172019 LTIP wasand based on the financial metricsresults shown above for the three-year performance period ending December 31, 2019, and2021, is reflected in the table below.
NEO | 2017 LTIP Performance
Shares Target Award | 2017 Performance Share
Payout |
James K. Kamsickas | | 126,663 | | | 125,395 | |
Jonathan M. Collins | | 31,985 | | | 31,665 | |
Mark E. Wallace | | 34,135 | | | 33,793 | |
Aziz S. Aghili | | 26,356 | | | 26,092 | |
Robert D. Pyle | | 24,667 | | | 24,419 | |
| | James K. Kamsickas | | | 168,311 | | | 41,067 | |
| | Timothy R. Kraus | | | 9,929 | | | 2,422 | |
| | Jonathan M. Collins | | | 44,903 | | | 10,956(1) | |
| | Aziz S. Aghili | | | 36,945 | | | 9,014 | |
| | Douglas H. Liedberg | | | 21,721 | | | 5,299 | |
| | Antonio Valencia | | | 8,939 | | | 2,180 | |
(1)
| Mr. Collins forfeited his long-term incentive award as a result of his voluntary departure from the Company on December 15, 2021. |
Other Elements of Compensation
To remain competitive with other companies and to retain, attract and motivate highly talented executives, we provided
perquisitescertain other benefits to our NEOs in
2019, as well as2021, including health, wellness and retirement benefits.
Executive Perquisites
PlanWe administered an Executive Perquisites Plan in 2019 that provided an annual fixed cash allowance to eligible employees (including our NEOs) in lieu of individual executive perquisites. The program was designed as part of a competitive pay package to assist in retaining and recruiting talented executives.
We do not offer significant individual perquisites to our NEOs such as car allowances, club memberships, and tax and financial planning. Our cash perquisite programMr. Valencia is provided a taxable benefit paid on a semi-monthly basis and we do not provide tax gross-up payments to cover applicable taxes on the allowance. Our Chairman and CEO was entitled to and received $50,000 under the plan, and the remaining NEOs were each entitled to and received $35,000. To better align with market practices, effective January 1, 2020, our NEOs will no longer participateleased car as an element of his compensation in the Executive Perquisites Plan and will no longer receive any cash allowance, nor will individual perquisites be offered to our NEOs.his Switzerland-based role.
TABLE OF CONTENTS
International Assignment Benefits
We maintain an International Assignment Policy for certain employees who accept an international assignment at the request of Dana. The benefits under this program generally include some or all of the following benefits as needed: cost of living allowance, location premium, relocation allowance, housing allowance, transportation allowance, tax preparation, assignment completion payment, repatriation allowance and annual home leave. Mr. Aghili received benefits under this program in
2019.2021 reflecting trailing costs associated with the end of his assignment and repatriation in 2020.
For more information on the benefits provided to Mr. Aghili, see the “Summary Compensation Table” and related footnotes.
Health
&and Welfare – Wellness Benefits
We
also provide other benefits such as medical, dental, life insurance, accidental disability and dismemberment insurance, short-term disability and long-term disability to our NEOs, which are also provided to all eligible U.S.-based salaried employees. Eligible employees can purchase additional life, dependent life and accidental death and dismemberment coverage as part of their employee benefits package. Our NEOs and certain other manager-level employees may also purchase supplemental long-term disability insurance.
TABLE OF CONTENTS
As part of our employee health and wellness benefit initiatives, we provide to certain executives, including Messrs. Kamsickas, Collins, Wallace, Aghili and Pyle,our NEOs, an executive physical program in which we strongly encourage participation. The benefit provides an annual routine wellness examination and physical at a cost to Dana of approximately $2,600 per executive with a slightly higher cost for initial participation.
We maintain a tax-qualified, “safe harbor” 401(k) plan for our employees, including the NEOs. Eligible participants may make voluntary contributions to the plan up to Internal Revenue Code limits. Dana makes both matching contributions and a fixed contribution to each eligible employee’s 401(k) plan account. We match 100% of the employee’s contributions up to 3% of compensation and 50% of the employee’s contributions from 3% to 5% of compensation, providing a maximum employer match of 4% of compensation to an employee. We
providegive a company fixed contribution equal to 3.5% of each eligible employee’s compensation.
We provide a non-qualified savings plan (restoration plan), to which we credit amounts to participants, including our NEOs, that we would have otherwise provided as matching and fixed contributions under the 401(k) plan if IRS statutory limits on 401(k) plan contributions had not been applicable.
We also
provideadminister a non-qualified defined contribution
Supplemental Executive Retirement Plansupplemental executive retirement plan (SERP) for certain executives, including our NEOs. We believe that the SERP enables us to provide our NEOs with a competitive retirement program in line with our peers. A portion of the SERP benefit is based on our performance.
We offer a non-qualified deferred compensation plan that allows eligible employees, including our NEOs, to defer base salary and/or incentive pay to be paid at a future date. For more information regarding our non-qualified retirement programs, see the narrative following the “Nonqualified Deferred Compensation” table.
How We Make Compensation Decisions are Made
Role of the Compensation Committee and
Chairman and CEOThe Compensation Committee of the Board of Directors assists the Board in fulfilling its obligations related to the compensation of Dana’s executive officers and, in general, with respect to compensation and benefits programs relating to all employees. Our current Compensation Committee consists of a chair and independent directors who are appointed annually by the Board. Under its Charter, the Compensation Committee must have a minimum of three members who meet the requirements for independence as set forth by the Securities and Exchange Commission (SEC), the New York Stock Exchange (NYSE) and our Standards of Director Independence. Members of the
Compensation Committee must also qualify as “non-employee directors” within the meaning of Exchange Act Rule
16b-3 and as “outside directors” for purposes of Section 162(m) of the Internal Revenue Code.Keith E. Wandell16b-3.
Rachel A. Gonzalez served as Chair of the Compensation Committee
for part of 2019 before stepping down as Chair and Committee member. Mr. Wandell was succeeded by Rachel A. Gonzalez who was named Chair and served in that capacity for the remainder of the year. Virginia A. Kamsky relinquished her role as a member of the Compensation Committee during
the year.2021. The other members of the Compensation Committee serving in
20192021 included Michael J. Mack,
Jr., R. Bruce McDonald and Diarmuid B. O’Connell.
The Compensation Committee’s responsibilities include, but are not limited to:
| ► | Reviewing our executive compensation philosophy and strategy; |
| ► | Participating in the performance evaluation process for our Chairman and CEO; |
| ► | Setting base salary and incentive opportunities for our Chairman and CEO and other senior executives; |
| ► | Establishing the overarching pay philosophy for Dana’s management team; |
TABLE OF CONTENTS
| ► | Establishing incentive compensation and performance goals and objectives for our executive officers and other eligible executives and management, and determining whether performance objectives have been achieved; and |
| ► | Recommending employment and severance agreements for our Chairman and CEO and other senior executives to the Board. |
Executive sessions are held by theThe Compensation Committee holds executive sessions without the participation of any member of executive management, including the NEOs, typically to discuss compensation matters germanepertaining to the Chairman and CEO. Each year, the Compensation Committee reviews the performance and total compensation package of our NEOs and reviews and establishes each NEO’s total target and actual compensation for the current year including base salary, annual bonus opportunities and long-term incentive awards.
Our Chairman and CEO is responsible for making recommendations to the Compensation Committee regarding base salary and incentive opportunities for the NEOs other than with respect to his own compensation.
TABLE OF CONTENTS
Compensation decisions are made by the Compensation Committee using its sole judgment. The Compensation Committee focuses primarily on each NEO’s performance against his or her financial and strategic objectives, Dana’s overall performance, and a business unit’s performance where applicable, while reserving discretionauthority to reflectmake decisions based on overall business performance. No discretion was used in 2019 to change pay outcomes.
performance, conditions and challenges.
Role of the Independent Compensation Consultant
The Compensation Committee’s charter states the
Compensation Committee may retain outside compensation consultants, legal
advisorscounsel or other advisors. The
Compensation Committee retains an independent compensation consultant, Mercer (US) Inc. (Mercer), a wholly owned subsidiary of Marsh & McLennan Companies, Inc. (MMC), to advise it on certain compensation matters. The
Compensation Committee has the sole authority to retain, compensate and terminate any independent compensation consultants of its choosing.
In connection with the Compensation Committee’s engagement of Mercer, the
Compensation Committee considered factors relevant to Mercer’s independence, including six factors specified by NYSE rules, and determined that Mercer’s work does not raise any conflict of interest. The
Compensation Committee requested Mercer’s advice on a variety of issues, including compensation strategy, market comparisons, review of our Peer Group, pay and performance alignment versus industry peers, executive pay trends, stock ownership guidelines, compensation best practices and potential compensation plan designs and modifications.
Mercer provided the Peer Group and general industry compensation data to management and the Compensation Committee, and it was used as a frame of reference for establishing compensation targets for base salary, annual bonus and long-term incentives for all of
theour NEOs at the beginning of
2019.2021.
In addition to its services for the Compensation Committee, separate and distinct from executive and director compensation consulting services, Mercer provided select services for Dana in various other capacities in
2019.2021. Those services included other global compensation consulting where Mercer data was most relevant in a given country. Mercer’s fees for executive compensation consulting in fiscal year
20192021 were
$184,200.$179,205. During the fiscal year, Dana retained Mercer (and its MMC affiliates) to provide services unrelated to executive compensation. The aggregate fees paid for these other services were
$30,845.$16,825. These other services were not approved by our Board of Directors or the Compensation Committee because they relate to broad-based compensation and benefit plans. Our management used Pay Governance LLC (Pay Governance) for
additional executive compensation advice.
Compensation Policies &and Practices
Dana’s Stock Ownership GuidelinesThe Compensation Committee applies
Our NEOs must comply with stock ownership guidelines
for our NEOs to encouragethat require executives to own a significant number of shares of our common stock. The stock ownership guidelines are calculated based on a multiple of the executive’s annual base salary and the average stock price during the prior calendar year.
We require
To further strengthen our ownership culture and alignment with the interests of our shareholders, the Compensation Committee approved several changes to the stock ownership guidelines for senior executives, including the NEOs, to achieve the required percentage of the targeted stock ownership levels on a schedule from two to five years of being promoted or named to the applicable executive position. which took effect January 1, 2021, as reflected below.
| ► | Increased the multiple applicable to the Chairman and Chief Executive Officer from 5x to 8x; |
| ► | Increased the multiple applicable to the Chief Financial Officer from 3x to 5x; |
| ► | Extended ownership requirements to include all Company senior vice presidents; |
| ► | Eliminated the phased approach to ownership achievement; and |
| ► | Restricted the sale of shares acquired upon vesting of awards until ownership requirements have been met. |
TABLE OF CONTENTS
In determining
if our NEOs have satisfiedthat the ownership requirements
are satisfied, we generally include RSUs that have been granted and any shares owned outright by the
NEO.executive. Stock options and unearned performance shares are not counted in determining stock ownership for this purpose.
The table below shows the schedule for attaining the targeted amount Executives have five years beginning from date of stock ownership:
Title | Minimum
Investment | Percentage of Ownership
Guideline to Satisfy |
2
Years | 4
Years | 5
Years |
Chairman and Chief Executive Officer | 5 x Base Salary | | 40 | % | | 80 | % | | 100 | % |
Other NEOs | 3 x Base Salary | | 40 | % | | 80 | % | | 100 | % |
| | Chairman and Chief Executive Officer | | | 8x Base Salary | |
| | Chief Financial Officer | | | 5x Base Salary | |
| | Executive Vice Presidents and General Counsel | | | 3x Base Salary | |
| | Senior Vice Presidents | | | 1x Base Salary | |
All NEOs had exceeded, met or exceeded thewere on track to meet their ownership requirements according to the above schedulerequirement as established under our guidelines.
To mitigate risk to Dana of paying either annual or long-term incentives based on faulty financial results, we have a policy (Clawback Policy) regarding adjustment of performance-based compensation in the event of a restatement of our financial results. It provides that the Compensation Committee will review all bonuses and other compensation paid or awarded to our executive officers based on the achievement of corporate performance goals during the period covered by a restatement. If the amount of such compensation paid or payable to any executive officer based on the originally reported financial results differs from the amount that would have been paid or
TABLE OF CONTENTS
payable based on the restated financial results, the Compensation Committee will make a recommendation to the independent members of the Board as to whether to seek recovery from the executive officer of any compensation exceeding that to which he or she would have been entitled based on the restated results. In the case of Mr. Kamsickas, his executive employment agreement sets forth clawback provisions in addition to the Clawback Policy provisions described above. These additional clawback provisions are described below under “CEO Employment Agreement.”
Hedging
&and Pledging of Dana Stock
Under the terms of our “Insider Trading
Policy,”Policy”, no employee, officer or
directornon-employee Director is permitted to engage in securities transactions that would allow them either to insulate themselves from, or profit from, a decline in Dana’s stock price. Similarly, no employee, officer or director may enter into hedging transactions in Dana’s stock. Such transactions include, but are not limited to, short sales as well as any hedging transactions in derivative securities (i.e., puts, calls, options, swaps, forward contracts or collars) or other speculative transactions relating to Dana’s stock. Pledging of Dana’s stock is also prohibited.
Equity-Based Grant Practices
Under our equity-based grant practices, we make regular equity-based grants to eligible employees, including
our NEOs, in the first quarter of the calendar year at a regularly scheduled meeting of the Compensation Committee. Under our current practice, the exercise price, in the case of any stock options, is the closing price of our common stock on the NYSE on the date of the grant. We also may award equity-based grants during the year to newly hired executive officers as part of their compensation package or to executives based on a promotion during the year. In the case of equity-based grants to newly hired employees who may be
covered employees within the meaning of Section 162(m) of the Internal Revenue Code, or officers subject to Section 16 of the Exchange Act, including NEOs, the grants are authorized by the
Compensation Committee.
Mitigation of Potential Risk in Pay Programs
The Compensation Committee has reviewed our compensation policies and practices and determined that there are no risks arising from our compensation policies and practices for our employees that are reasonably likely to have a material adverse effect on Dana. To avoid excessive risk-taking behaviors, Dana has put in place several mechanisms, including, but not limited to:
| ► | Stock ownership guidelines; |
| ► | Caps on annual incentive payouts; |
| ► | Financial performance-based annual incentive program; |
| ► | Long-term incentive awards (whichthat are delivered primarily in the form of equity);equity; |
| ► | Mix of multiple types of awards and performance assessment periods; |
| ► | Use of multiple metrics and performance periods to determine annual and long-term incentive payouts; and |
| ► | Clawback and anti-hedging and pledging policies. |